A new report has been published by Oxford City Council, providing a breakdown of the key sources of air pollution in the city.
The Oxford Source Apportionment report, which was conducted by Ricardo Group, highlights that road transport remains the highest contributor to NOx emissions, while domestic wood burning is the largest contributor to particulate pollution (PM2.5) in the city.
The report examines the contributions of different sectors to air pollution in Oxford (transport, domestic combustion, point sources, other transport, and other emissions), focusing on nitrogen oxides (NOX – a combination of nitric oxide (NO) and nitrogen dioxide (NO2)) and fine particulate matter (PM2.5 and PM10).
The report is based on air pollution data measured in 2022, as well as modelling on the impact of the introduction of 159 electric buses in Oxford through the Government's ZEBRA scheme.
The report found that while road transport remains the largest source of NOX pollution (32%), domestic combustion—particularly wood burning—is the leading cause of harmful PM2.5 emissions (24%).
Key findings of the report:
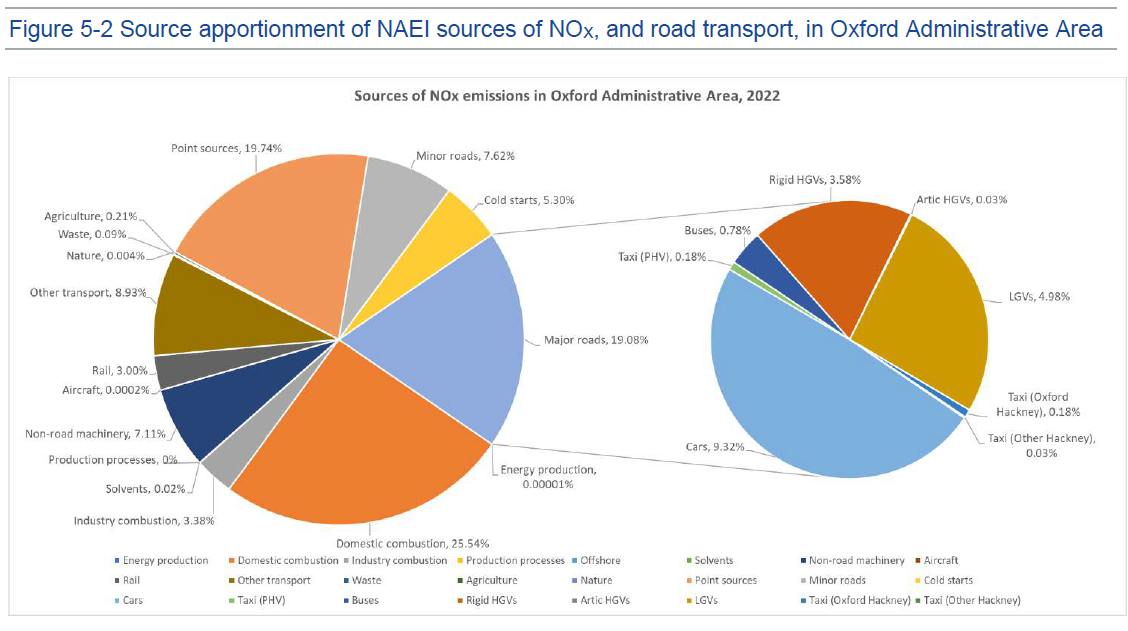
- Road transport remains the largest contributor to NOX pollution - accounting for 32% of total NOX emissions.
- Domestic combustion accounts for 26% of total NOX emissions.
- Point sources (emissions from sources at a known location that can be directly mapped such as industry or commercial buildings) contribute 20% of total NOX emissions.
- Other road transport (including boats, and military aircraft) accounts for 9% of total NOX emissions.
- Other emissions (including rail and aircrafts, non-road mobile machinery, industry, waste, solvents, agriculture, and production processes) accounts for 13% of total NOX emissions.
- Domestic wood burning is the highest contributor to PM2.5 pollution, accounting for 24% of total PM2.5 emissions.
- Buses contribute 4% to total NOX emissions, reflecting a significant (28%) reduction since the previous source apportionment study, due to Oxford’s transition to electric buses.
Road Transport
Road transport remains the largest single contributor to NOX pollution, with diesel vehicles dominating emissions.
When looking at the specific sources of NOX within the road transport sector:
- Cars (petrol and diesel) account for 48% of total road transport NOX emissions.
- Heavy Goods Vehicles (HGVs) account for 19%.
- Light Goods Vehicles (LGVs) account for 26%.
- Buses contribute 4% to total NOX emissions, reflecting a significant (28%) reduction since the previous source apportionment study, due to Oxford’s transition to electric buses.
- Private hire and Hackney taxis account for 2%.
Since the previous Source Apportionment Study, road transport NOX emissions have dropped from 40% to 32%, primarily due to the introduction of electric buses under the government’s ZEBRA scheme. Buses now contribute to 4% to total NOX emissions in the city.
Hotspot Locations
In addition to transport emissions across the whole city, the report also looked at pollution in three ‘hotspot’ locations - St Clement’s, Botley road and Worcester Street - which have historically seen high levels of air pollution and are key roads for vehicles to travel into and across the city.
The findings show:
- Cars are the biggest contributors to NOX across all three locations.
- LGVs and HGVs follow as the next most significant contributors.
- Buses have seen a reduction in their contribution to NOX emissions, following the transition to electric in 2024.
- Private hire taxis contribute more to NOX emissions than Hackney Carriages – with both sources combined accounting for 2% of NOX.
Domestic Combustion
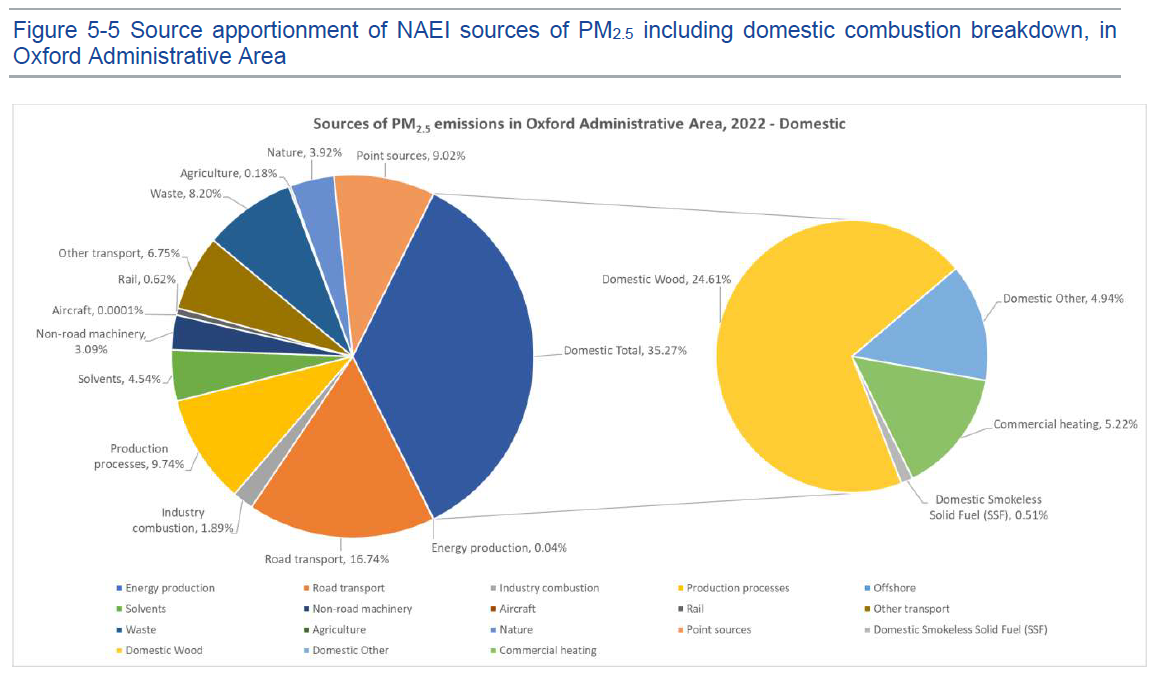
The report highlights that the domestic combustion sector (which includes emissions from burning wood, coal, and gas to heat homes) is responsible for 35% of total PM2.5 emissions citywide - with wood burning alone accounting for 25%.
When looking at the specific sources of PM2.5 within the domestic combustion sector:
- Wood burning accounts for 70% of all PM2.5 emissions relating to domestic combustion.
- Commercial heating (in businesses and institutions) contributes 15%.
- Gas and coal (domestic others) burning contributes 14%.
- Smokeless fuels account for just 1%.
Other sources of emissions
Other sources of NOX emissions in Oxford includes:
- Point sources (such as industry and commercial buildings) contribute 20% of total NOX emissions.
- Other road transport (including boats, and military aircraft) accounts for 9% of total NOX emissions.
- Other emissions (including rail and aircrafts, non-road mobile machinery, industry, waste, solvents, agriculture, and production processes) account for 13% of total NOX emissions.
There is no safe level of air pollution
In Oxford, the main pollutant of concern is nitrogen dioxide (NO2). Over the past few years, Oxford’s air quality has improved significantly, and since the introduction of the city’s current Air Quality Action Plan in 2021, NO2 levels across Oxford have seen a 18% average reduction.
Oxford is currently in compliance with the UK’s legal limit for NO2 in all areas of ‘relevant exposure’ within the city (40 µg/m³). However, there is ultimately no safe level of NO2 exposure.
In September 2021 the World Health Organization (WHO) recommended a much ‘safer’ annual mean level of NO2 of 10 µg/m³. Under its current Air Quality Action Plan, which was established in January 2021, Oxford has set its own voluntary annual mean target for NO2 of 30 µg/m³) to be achieved across the city by 2025.
Next Steps
The report will inform the Council's upcoming Air Quality Action Plan, which will be updated in 2026 following public consultation later this year.
An Air Quality Action Plan (AQAP) outlines the actions that the Council and its partners will take to improve air quality in Oxford within a certain period of time.The Council’s current Air Quality Action Plan can be read here.
For more information on air quality in Oxford, visit the Council’s Air Quality pages.
Comment
"This latest source apportionment study shows us to the key sources of toxic air pollution in Oxford, and what areas we need to focus on to improve air pollution across the city.
"We can see that there has been a significant reduction in the contribution of buses to NOX levels following the introduction of the 159 electric bus fleet. However, cars remain the largest contributor to this pollution.
“The report also highlights that we must address the growing issue of domestic wood burning, which is now the largest source of harmful PM2.5 pollution in Oxford. Many people may not realise that even modern wood stoves produce dangerous emissions. By reducing wood burning and supporting zero-emission transport, we can continue to improve Oxford’s air quality for everyone.”
Councillor Anna Railton, Deputy Leader and Cabinet Member for Zero Carbon Oxford, Oxford City Council
"The modelled impact that the new fleet of electric buses is having on air quality in Oxford in such as short space of time is remarkable. We are incredibly proud to have put together the successful bid alongside the bus companies to bring them to the city, and this new report shows why it was such an important initiative in creating a cleaner, greener county.”
Councillor Andrew Gant, Oxfordshire County Council’s Cabinet Member for Transport Management
“We’re proud of the massive step change in emissions buses have delivered in Oxford over the last decade to help provide radically cleaner air for the communities we serve.
“This has been sustained over several years with the move to ultra-low emission vehicles and more recently zero emission vehicles, following significant investment by both companies.
“However, overall Oxford's air is not benefitting as much as it could be due to the steadily increasing proportion of car and van emissions. The data clearly demonstrates that it’s vital for Oxford’s health that suitable measures are introduced to help reduce the volume of private vehicles on the city’s roads to achieve even greater improvements in air quality.”
Luke Marion, Managing Director of Oxford Bus Company
Rate this page


